So
your application is running out of memory, you’re spending days and
nights analyzing your application hoping to catch the
memory holes in your objects.
What is Memory Leak?
Memory leak is a bug that mainly occurs when a program does not release the memory it has obtained for temporary use.
Memory leak is a bug that mainly occurs when a program does not release the memory it has obtained for temporary use.
Definition
of Memory Leak: objects are no longer being used by the
application, but Garbage Collector cannot remove them because they are being
referenced.
How to determine if Memory Leak
exists in a Java application?
If
the application throws java.lang.OutOfMemoryError or if the program takes more
time to execute than is required normally then there could be a memory leak in
the application. There are various third party tools to detect and fix memory
leaks but it is always better to prevent one from happening
The
below steps will explain how to monitor and detect your memory leaks to make
sure your app is on the safe side.
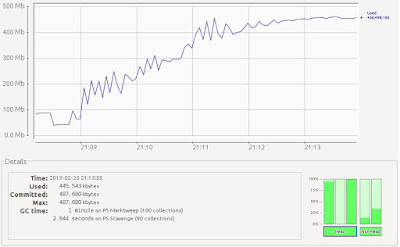
1. Memory leak suspicion
If
you have a suspicion, there is a memory leak a convenient way to
make sure it’s really there is using jconsole. You can locally or
remotely connect jconsole to your app and let it monitor for a while (Hour,
Half day, Overnight, Week.) After connecting jconsole to your app start
analyzing the “Memory” tab. A memory leak suspicion would look like this:
2. How to find the leaking sources in
your application
For
this purpose, I recommend using jvisualVM. this tool is part of the JDK. Inside
jvisualVM you can take Heap Dump (Inside the “Monitor” Tab). Please keep in
mind that it’s not possible to create Heap-Dump remotely. You’ll need
to either run jvisualvm on the same machine or execute jmap command to produce
a Heap-Dump file and import it later into jvisualvm.
*
Jmap is an oracle tool that prints all objects memory map tree for a
given process.
So basically you
run the jmap on your remote server (for instance your
production environment) and then analyze that file locally. I recommend to
do several Heap dumps. That will give you better picture whether you have
memory leaks or not.
3. Analyzing the Heap dump file
I
personally like to use MAT (Eclipse Memory Analyzer) (http://www.eclipse.org/mat/). MAT takes
the heap dump file and helps you find memory leaks. MAT shows exactly which
instances have memory growth suspects. You might notice
Java libraries instances as a ‘Problem Suspect’ such as:
“java.lang.Class” but this is normal.
Example
for a leak detection
Here
you can see the exact instance which is suspected as a leaking component.
4. Analyze suspected objects
Next
step is to press on the details field of the suspected instance and investigate
the objects inside:
In
the above example we can see clearly that field of type TreeMap is
growing.
5. Fix your leak and run the test
again
Now
what’s left is to understand and fix your leaking source – but of course this
is individual for each object. These step-by step directions will
help you detecting the leaking memory objects.


No comments:
Post a Comment